School website service training and support

Analytics

SWS analytics dashboard
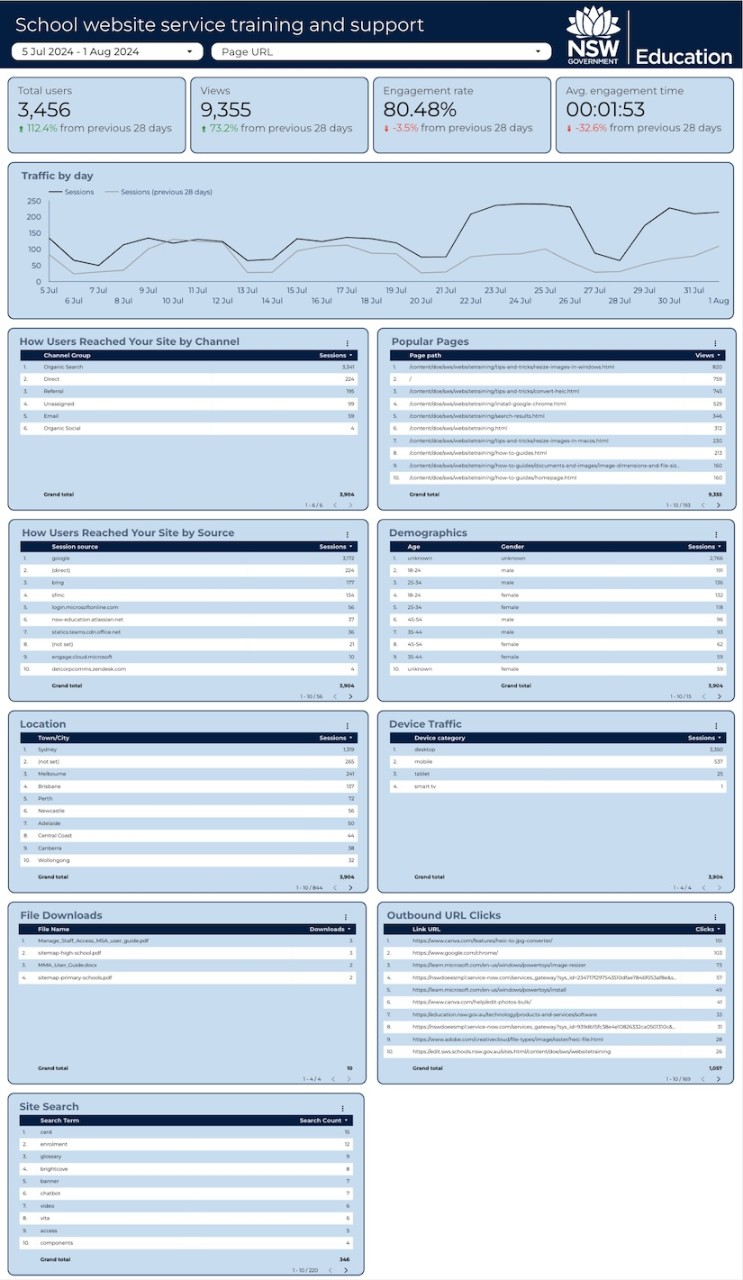
An example of the SWS analytics dashboard.

The SWS analytics dashboard will help you understand how people are using your website and how you can make it better.

You can easily pick different dates to see your website’s performance over time, and filter by different pages to get specific information.

Data on the dashboard is only available from 16 May 2024 onward. This means the dashboard will become even more useful as more data is collected over time.

A URL to your SWS analytics dashboard was sent to all school inboxes on 26 June 2024. 

Please ensure you are signed in to your department Google account in order to access the dashboard.

If you can't access the analytics dashboard, please contact SWS technical support.


Glossary of terms

Dimensions

  • Channel Group: This groups the sources of your traffic into broader categories like:
    •  Organic Search: Traffic from search engines like Google or Bing.
    •  Social: Traffic from social media platforms like Facebook, Instagram, or Twitter (X).
    •  Direct: Traffic from people who typed your website address directly into their browser or used a bookmark.
    •  Referral: Traffic from people who clicked on a link to your site from another website.
    •  Email: Traffic from links clicked in email campaigns.
    •  Paid Search: Traffic from paid advertising in search engines.
  • Page Path: This is the URL of the page on your site. It shows which specific page a user visited. "/" signifies the homepage of your website. 
  • Session Source: This tells you where the user came from to start their session on your site. For example, it could be "Google," "Facebook," or "Direct" (if they typed your URL directly into their browser). 
  • Age: This tells you the age groups of the people visiting your site. 
  • Gender: This gives you an idea of whether the users are mostly male or female. 
  • Town/City: This shows the cities or towns where your visitors are located. 
  • Device Category: This tells you what kind of device people are using to visit your site, like a mobile phone, tablet, or desktop computer. 
  • File Name: This is the name of the file that was downloaded. 
  • Link URL: This is the web address (URL) of any clicked links on your site. 
  • Search Term: This shows the words or phrases people typed into your website's search bar.

Metrics

  • Total Users: This tells you how many different people visited your website. Each person is counted once, no matter how many times they visit.
  • Views: This number shows how many times users have looked at individual pages on your site. If the same person visits a page multiple times, each visit is counted.
  • Engagement Rate: This percentage shows how many users interacted with your site in a meaningful way (like by clicking links or spending a certain amount of time) divided by the total number of users.
  • Average Engagement Time: This metric tells you, on average, how much time users spend actively engaging with your site during a session.
  • Sessions: This is the number of times people start visiting your site. A new session starts when there's no activity for 30 minutes, and then a user starts interacting again.
  • Downloads: This number tells you how many times files were downloaded from your site.
  • Clicks: This indicates how many times users clicked on links that take them away from your site to another website.
  • Search Count: This number tells you how many times a specific search term was used on your site.